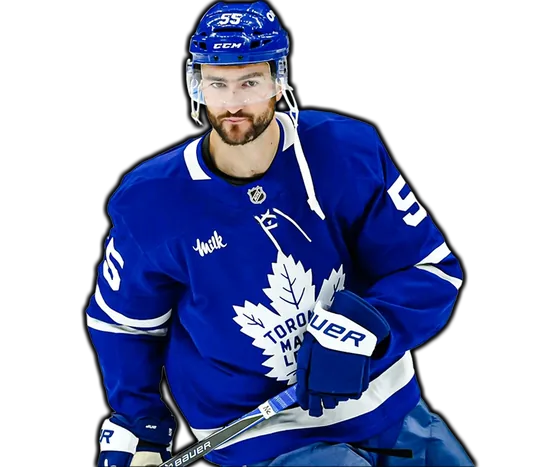
Morgan Rielly is the partner who brings the best out of him
Roy is at his best beside Rielly: 54.9% of the expected goals together against 40.7% apart.
217 minutes together, 486 minutes apart
It stops working when he is paired with Bobby McMann
The pairing with McMann is the one that costs him: 36.6% of the expected goals together, 47.4% apart.
158 minutes together, 544 minutes apart
Teammates play better with him than they do without him
Robertson is a different player beside him: 49.8% of the expected goals with Roy, 40.6% without him.
259 minutes together, 616 minutes apart for Robertson
Teammates tend to play worse when he is on their line
McMann does better away from him: 48.1% of the expected goals apart against 36.6% together.
158 minutes together, 668 minutes apart
His linemates play better with him than without him, every time
8 of his 12 regular 5v5 partners post a better expected-goal share beside Roy than away from him.
partners with at least 100 minutes together and apart
He and Jake McCabe are the pair that scares the other team
The pairing that generates most is Roy and McCabe: 4.32 expected goals an hour.
230 minutes together at 5v5
Dakota Joshua is the partner his coach keeps going back to
He spends more 5v5 time with Joshua than anyone: 282 minutes, worth 48.7% of the expected goals.
14 goals for, 11 against together
The goals go his team's way when Bobby McMann is out there with him
With McMann on the ice too, the Avalanche have outscored opponents 10 to 4 at 5v5.
71.4% goal share over 158 minutes
Nothing gets through when he and Philippe Myers are out together
He gives up least beside Myers: 3.16 expected goals against an hour.
106 minutes together at 5v5
Simon Benoit is who he kills penalties with, almost every time
Killing penalties he is tightest with Benoit: 11.6 expected goals against an hour.
41 minutes together short-handed
His coach keeps shuffling the players around him
Roy has been shuffled through 29 different five-man units and none of them have settled.
units of at least 5 minutes; 30 minutes counts as settled
The same few teammates are on the ice with him all night
13 teammates have played at least 100 5v5 minutes with Roy this season.
each of them also has that long apart from him, so every split below is a real split
Nicholas Robertson is the teammate who sets him up more than anyone
Nicholas Robertson has assisted on 3 of his 8 goals, 37.5% of them.
1 primary, 2 secondary
Nicholas Robertson is the teammate he sets up more than anyone
He has helped on 3 of Nicholas Robertson's goals, 17.6% of his own assists.
2 primary, 1 secondary
His assists are the real ones, the pass that made the goal
70.6% of his assists are primary, the pass that actually made the goal.
12 primary of 17 assists
One teammate is responsible for most of his goals
11 different teammates have assisted on his 8 goals.
Robertson (3), McMann (3), Bardakov (1), Nelson (1)
The kill leaks goals when he is the one out there
Short-handed he concedes 12.66 expected goals an hour.
9 goals against in 104 minutes, 173rd of 180 forwards
His line gets badly outshot when it is out there
43.3% of the 5v5 shots on goal go his way when Roy is on.
259 for, 339 against, 422nd of 454 forwards
His results are about what the underlying play deserves
His 5v5 on-ice percentages add to 102.8, running hot and likely to cool.
12.0% shooting and 90.9% goaltending behind him, 68th of 454 forwards
The other team gets whatever it wants when he is on
Opponents get 62.55 shot attempts an hour with Roy on the ice at 5v5.
403rd of 454 forwards
His side chases the puck while he is out there
Roy's line owns 45.2% of the 5v5 shot attempts.
604 for, 732 against, 392nd of 454 forwards
Play tilts towards his own net when he is out there
At 5v5 the Avalanche generate 44.8% of the expected goals with Roy on the ice.
43.7 xGF to 53.9 xGA over 702 minutes, 388th of 454 forwards
The offence goes quiet when he steps on the ice
The Avalanche create 3.73 expected goals an hour at 5v5 with Roy on.
388th of 454 forwards
His line finishes better than the chances it creates
His line is scoring above the chances it creates: 50.0% of the goals off 44.8% of the expected goals.
5.2 points of goal share above expectation
The defence springs leaks when he is out there
He gives up 4.61 expected goals an hour at 5v5.
307th of 454 forwards
The goals go the wrong way when he is on the ice
The Avalanche are down 3 goals with Roy on the ice.
42 for, 45 against, 276th of 466 forwards
Goals go both ways evenly when he is on
The Avalanche score 50.0% of the 5v5 goals with Roy out there.
31 for, 31 against, 204th of 454 forwards
He gets a normal share of the minutes
Roy plays 14:45 a night, 247th among forwards.
871 minutes across 59 games
He takes an ordinary share of the penalty killing
He draws 1:49 of penalty kill time a game, 83rd among forwards.
11.9% of his total ice time
How he gets his points says what kind of player he is
Only 8.0% of his points come on the power play: this is even-strength production.
2 of 25 points with the man advantage
He chips in points even when his team is a man down
He has 1 short-handed points this season.
165th in the league
He wins the draws his team needs him to win
He wins 52.3% of his draws.
111th in the league
He takes the puck off people more than almost anyone
He takes the puck back 1.18 times an hour.
208th in the league
He gives the puck away more than he should
21 takeaways against 62 giveaways: he loses it far more often than he wins it back.
0.34 takeaways per giveaway
He hands the puck over more than he should
He gives it away 3.48 times an hour.
254th most giveaways an hour
He is the one who makes the play, not the one who finishes it
He sets up 0.95 assists an hour of ice time.
352nd in the league
He rarely puts a puck on net of his own
He puts 4.26 shots on goal an hour.
604th in the league
He produces at about the rate you would expect
Roy produces 1.4 points an hour of ice time.
421st in the league
His power play production is about league average
On the power play he produces 0.11 points an hour.
388th in the league
He blocks about as many shots as anyone else
He blocks 2.3 shots an hour of ice time.
550th in the league
He scores at about the rate you would expect
He scores 0.45 goals an hour of ice time.
449th in the league
He takes about as many penalties as anyone
He takes 1.29 penalty minutes an hour.
499th most penalty minutes an hour
He plays about as physical a game as anyone
He finishes 3.98 checks an hour.
458th in the league
He can beat goalies from further out than most players
5.0% of his attempts are fired from beyond 45 feet.
8 long-range attempts, 21st of 468 forwards
He gets his chances from the dirty areas, not the perimeter
65.8% of what he shoots comes from the slot.
106 attempts from inside the home plate, 46th of 468 forwards
His game is played in the hardest part of the ice
65.8% of his attempts come from inside 25 feet.
106 of 161 attempts, 46th of 468 forwards
He gets to the hard areas rather than firing from range
His average attempt comes from 22.2 feet.
161 located attempts, 50th of 468 forwards
He finds shooting lanes that most players cannot
25.5% of everything he shoots gets blocked before it arrives.
41 of 161 attempts, 381st of 468 forwards
There is one shot he goes to more than any other
20.5% of his attempts are the tip.
33 attempts, 4 goals
He works one side of the ice far more than the other
54.7% of his attempts come from the middle lane.
33 left, 88 middle, 40 right
A lot of his shots miss the net entirely
63.3% of his unblocked attempts actually hit the net.
76 of 120 unblocked, 318th of 468 forwards
He does not shoot, he looks to pass or carry instead
He fires 11.1 attempts an hour of ice time.
161 attempts in 871 minutes, 301st of 466 forwards
He barely shoots the puck across a whole season
Roy has taken 161 shot attempts this season.
68 on goal, 44 missed, 41 blocked, 285th of 468 forwards
He owns this goalie, and the numbers are not close
Roy has scored 1 times on Cam Talbot this season, more than on any other goaltender.
1 goals on 6 attempts, 16.7%
This goalie has his number and he cannot solve him
Sergei Bobrovsky has turned him away every time: 6 attempts, no goals.
0.0% conversion
No goalie has seen more of him than this one
No goalie has seen more of him than Logan Thompson: 8 attempts, 1 goal.
12.5% conversion
He wins the draw against this centre almost every time
He wins 90.0% of his draws against Trevor Zegras.
9 of 10 faceoffs
This centre beats him on the draw almost every time
Jack Drury beats him on the draw: he wins only 12.5% of them.
1 of 8 faceoffs
He is not converting the chances he gets
Roy has 8 goals off 14.1 expected: 6.1 short of what the chances say.
441st of 468 forwards
The chances in tight are not going in for him
From inside 25 feet he buries 6.6% of his attempts.
7 goals on 106 close attempts, 342nd of 468 forwards
There is a range from which his goals almost always come
His goals average 14.6 feet out, and the longest went in from 31.
8 goals located by coordinate
His shooting has gone cold this season
He converts 10.5% of the shots he puts on goal.
8 goals on 76 shots, 310th of 468 forwards
Show more
The numbers behind these live in Lineups.
Take me there
Morgan Rielly is the partner who brings the best out of him
Roy is at his best beside Rielly: 54.9% of the expected goals together against 40.7% apart.
217 minutes together, 486 minutes apart
It stops working when he is paired with Bobby McMann
The pairing with McMann is the one that costs him: 36.6% of the expected goals together, 47.4% apart.
158 minutes together, 544 minutes apart
Teammates play better with him than they do without him
Robertson is a different player beside him: 49.8% of the expected goals with Roy, 40.6% without him.
259 minutes together, 616 minutes apart for Robertson
Teammates tend to play worse when he is on their line
McMann does better away from him: 48.1% of the expected goals apart against 36.6% together.
158 minutes together, 668 minutes apart
His linemates play better with him than without him, every time
8 of his 12 regular 5v5 partners post a better expected-goal share beside Roy than away from him.
partners with at least 100 minutes together and apart
He and Jake McCabe are the pair that scares the other team
The pairing that generates most is Roy and McCabe: 4.32 expected goals an hour.
230 minutes together at 5v5
Dakota Joshua is the partner his coach keeps going back to
He spends more 5v5 time with Joshua than anyone: 282 minutes, worth 48.7% of the expected goals.
14 goals for, 11 against together
The goals go his team's way when Bobby McMann is out there with him
With McMann on the ice too, the Avalanche have outscored opponents 10 to 4 at 5v5.
71.4% goal share over 158 minutes
Nothing gets through when he and Philippe Myers are out together
He gives up least beside Myers: 3.16 expected goals against an hour.
106 minutes together at 5v5
Simon Benoit is who he kills penalties with, almost every time
Killing penalties he is tightest with Benoit: 11.6 expected goals against an hour.
41 minutes together short-handed
Show more
The numbers behind these live in Lineups.
Take me there
His coach keeps shuffling the players around him
Roy has been shuffled through 29 different five-man units and none of them have settled.
units of at least 5 minutes; 30 minutes counts as settled
The same few teammates are on the ice with him all night
13 teammates have played at least 100 5v5 minutes with Roy this season.
each of them also has that long apart from him, so every split below is a real split
Nicholas Robertson is the teammate who sets him up more than anyone
Nicholas Robertson has assisted on 3 of his 8 goals, 37.5% of them.
1 primary, 2 secondary
Nicholas Robertson is the teammate he sets up more than anyone
He has helped on 3 of Nicholas Robertson's goals, 17.6% of his own assists.
2 primary, 1 secondary
His assists are the real ones, the pass that made the goal
70.6% of his assists are primary, the pass that actually made the goal.
12 primary of 17 assists
One teammate is responsible for most of his goals
11 different teammates have assisted on his 8 goals.
Robertson (3), McMann (3), Bardakov (1), Nelson (1)
The numbers behind these live in Impact.
Take me there
The kill leaks goals when he is the one out there
Short-handed he concedes 12.66 expected goals an hour.
9 goals against in 104 minutes, 173rd of 180 forwards
His line gets badly outshot when it is out there
43.3% of the 5v5 shots on goal go his way when Roy is on.
259 for, 339 against, 422nd of 454 forwards
His results are about what the underlying play deserves
His 5v5 on-ice percentages add to 102.8, running hot and likely to cool.
12.0% shooting and 90.9% goaltending behind him, 68th of 454 forwards
The other team gets whatever it wants when he is on
Opponents get 62.55 shot attempts an hour with Roy on the ice at 5v5.
403rd of 454 forwards
His side chases the puck while he is out there
Roy's line owns 45.2% of the 5v5 shot attempts.
604 for, 732 against, 392nd of 454 forwards
Play tilts towards his own net when he is out there
At 5v5 the Avalanche generate 44.8% of the expected goals with Roy on the ice.
43.7 xGF to 53.9 xGA over 702 minutes, 388th of 454 forwards
The offence goes quiet when he steps on the ice
The Avalanche create 3.73 expected goals an hour at 5v5 with Roy on.
388th of 454 forwards
His line finishes better than the chances it creates
His line is scoring above the chances it creates: 50.0% of the goals off 44.8% of the expected goals.
5.2 points of goal share above expectation
The defence springs leaks when he is out there
He gives up 4.61 expected goals an hour at 5v5.
307th of 454 forwards
The goals go the wrong way when he is on the ice
The Avalanche are down 3 goals with Roy on the ice.
42 for, 45 against, 276th of 466 forwards
Goals go both ways evenly when he is on
The Avalanche score 50.0% of the 5v5 goals with Roy out there.
31 for, 31 against, 204th of 454 forwards
Show more
The numbers behind these live in Lineups.
Take me there
He gets a normal share of the minutes
Roy plays 14:45 a night, 247th among forwards.
871 minutes across 59 games
He takes an ordinary share of the penalty killing
He draws 1:49 of penalty kill time a game, 83rd among forwards.
11.9% of his total ice time
How he gets his points says what kind of player he is
Only 8.0% of his points come on the power play: this is even-strength production.
2 of 25 points with the man advantage
He chips in points even when his team is a man down
He has 1 short-handed points this season.
165th in the league
He wins the draws his team needs him to win
He wins 52.3% of his draws.
111th in the league
He takes the puck off people more than almost anyone
He takes the puck back 1.18 times an hour.
208th in the league
He gives the puck away more than he should
21 takeaways against 62 giveaways: he loses it far more often than he wins it back.
0.34 takeaways per giveaway
He hands the puck over more than he should
He gives it away 3.48 times an hour.
254th most giveaways an hour
He is the one who makes the play, not the one who finishes it
He sets up 0.95 assists an hour of ice time.
352nd in the league
He rarely puts a puck on net of his own
He puts 4.26 shots on goal an hour.
604th in the league
He produces at about the rate you would expect
Roy produces 1.4 points an hour of ice time.
421st in the league
His power play production is about league average
On the power play he produces 0.11 points an hour.
388th in the league
He blocks about as many shots as anyone else
He blocks 2.3 shots an hour of ice time.
550th in the league
He scores at about the rate you would expect
He scores 0.45 goals an hour of ice time.
449th in the league
He takes about as many penalties as anyone
He takes 1.29 penalty minutes an hour.
499th most penalty minutes an hour
He plays about as physical a game as anyone
He finishes 3.98 checks an hour.
458th in the league
Show more
The numbers behind these live in Shooting.
Take me there
He can beat goalies from further out than most players
5.0% of his attempts are fired from beyond 45 feet.
8 long-range attempts, 21st of 468 forwards
He gets his chances from the dirty areas, not the perimeter
65.8% of what he shoots comes from the slot.
106 attempts from inside the home plate, 46th of 468 forwards
His game is played in the hardest part of the ice
65.8% of his attempts come from inside 25 feet.
106 of 161 attempts, 46th of 468 forwards
He gets to the hard areas rather than firing from range
His average attempt comes from 22.2 feet.
161 located attempts, 50th of 468 forwards
He finds shooting lanes that most players cannot
25.5% of everything he shoots gets blocked before it arrives.
41 of 161 attempts, 381st of 468 forwards
There is one shot he goes to more than any other
20.5% of his attempts are the tip.
33 attempts, 4 goals
He works one side of the ice far more than the other
54.7% of his attempts come from the middle lane.
33 left, 88 middle, 40 right
A lot of his shots miss the net entirely
63.3% of his unblocked attempts actually hit the net.
76 of 120 unblocked, 318th of 468 forwards
He does not shoot, he looks to pass or carry instead
He fires 11.1 attempts an hour of ice time.
161 attempts in 871 minutes, 301st of 466 forwards
He barely shoots the puck across a whole season
Roy has taken 161 shot attempts this season.
68 on goal, 44 missed, 41 blocked, 285th of 468 forwards
Show more
The numbers behind these live in Matchups.
Take me there
He owns this goalie, and the numbers are not close
Roy has scored 1 times on Cam Talbot this season, more than on any other goaltender.
1 goals on 6 attempts, 16.7%
This goalie has his number and he cannot solve him
Sergei Bobrovsky has turned him away every time: 6 attempts, no goals.
0.0% conversion
No goalie has seen more of him than this one
No goalie has seen more of him than Logan Thompson: 8 attempts, 1 goal.
12.5% conversion
He wins the draw against this centre almost every time
He wins 90.0% of his draws against Trevor Zegras.
9 of 10 faceoffs
This centre beats him on the draw almost every time
Jack Drury beats him on the draw: he wins only 12.5% of them.
1 of 8 faceoffs
The numbers behind these live in Shooting.
Take me there
He is not converting the chances he gets
Roy has 8 goals off 14.1 expected: 6.1 short of what the chances say.
441st of 468 forwards
The chances in tight are not going in for him
From inside 25 feet he buries 6.6% of his attempts.
7 goals on 106 close attempts, 342nd of 468 forwards
There is a range from which his goals almost always come
His goals average 14.6 feet out, and the longest went in from 31.
8 goals located by coordinate
His shooting has gone cold this season
He converts 10.5% of the shots he puts on goal.
8 goals on 76 shots, 310th of 468 forwards
 Colorado Avalanche